
OMG! LOL! BTW…JK. In a world where the world just feels like it keeps spinning faster and faster, it seems like acronyms of all shapes and sizes have completely infiltrated every aspect of our lives including, but not limited to texting IMO 😆. We can sympathize…we work in SaaS, take it from us, we know acronyms (well, “most” of them anyway). But today we’re going to focus on one of the OG acronyms that is near and dear to everyone’s heart…Key Performance Indicators…KPI FTW!
Now let’s dig into this tried and true business metric we all know and love. Now, you can analyze and track all kinds of metrics through your marketing and sales funnel. But if you want to forecast sales accurately, hit quotas, and keep your team motivated, it’s best to focus on the metrics that truly matter.
This is why accomplished sales leaders rely on a handful of key performance indicators (KPIs). These are the numbers that can quickly summarize the state of sales at your company. If you dial in on the right KPIs, then sales performance management becomes a lot easier.
But which KPIs should you choose?
We’ve put together a list of 9 KPIs that a skilled sales leader might want to consider, along with how to calculate them and how to focus on the ones that are right for your organization.
9 examples of sales KPIs to track in 2024
Below is a list of sales KPIs worth tracking. If you monitor these, you can use the data to develop better-informed strategies, and you’ll also get a sense of your team’s strengths and weaknesses:
- Sales growth rate
- Percentage of targets realized
- Average sale price
- Average sales per rep
- Conversion rates (and variants)
- Conversion time
- Sales by contact method
- Sales by region or location
- Pipeline value
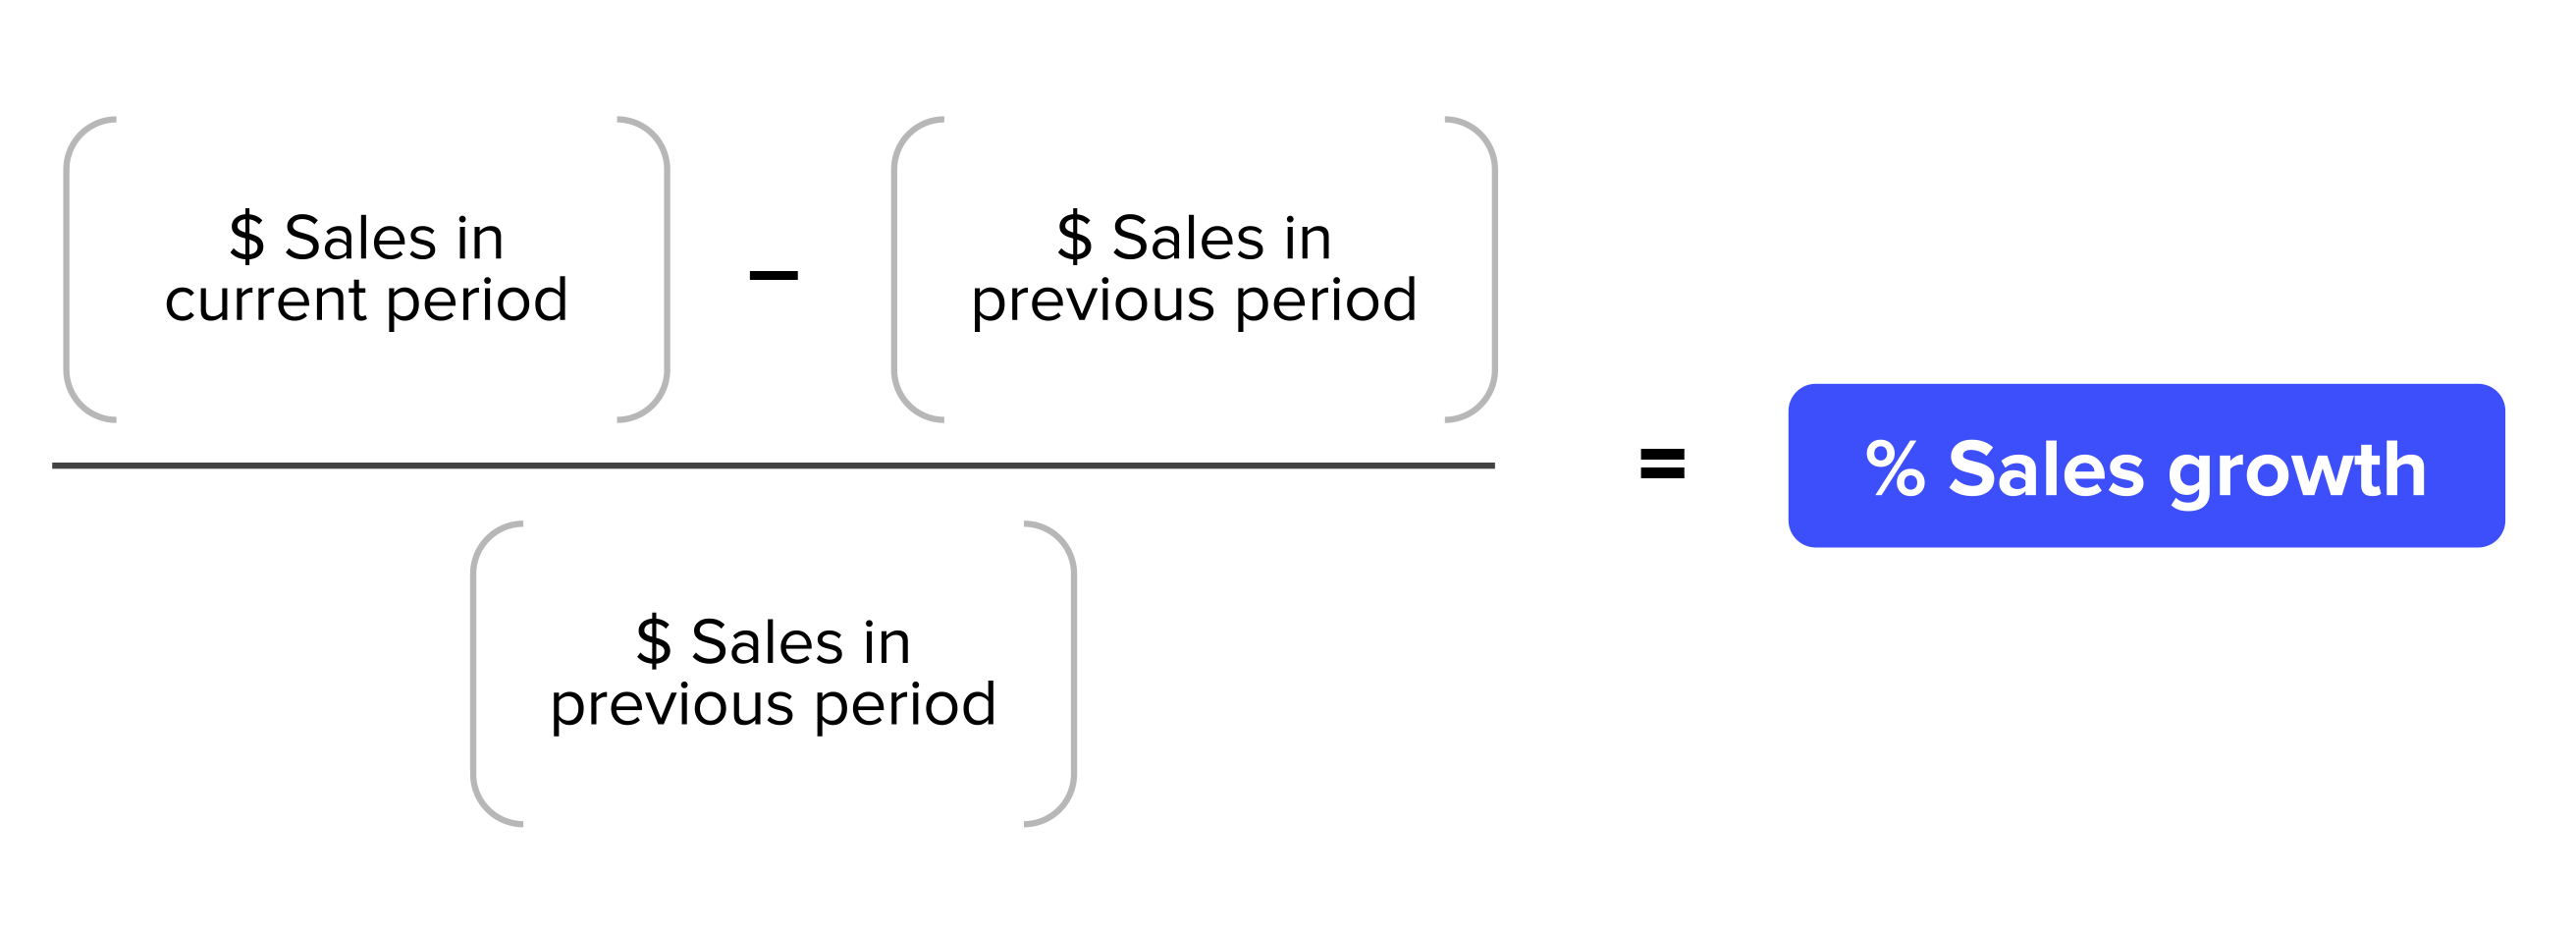
Sales growth rate
Sales growth rate measures how much your sales have grown (or declined) in the current period versus the previous period.
Percentage of targets realized
Based on planning and past sales, the sales target KPI shows how well each sales rep is doing each month. It’s a compelling performance indicator to demonstrate whether the forecasted revenue is on track or not. Sales reps also can see if they need to adjust or change their strategy.
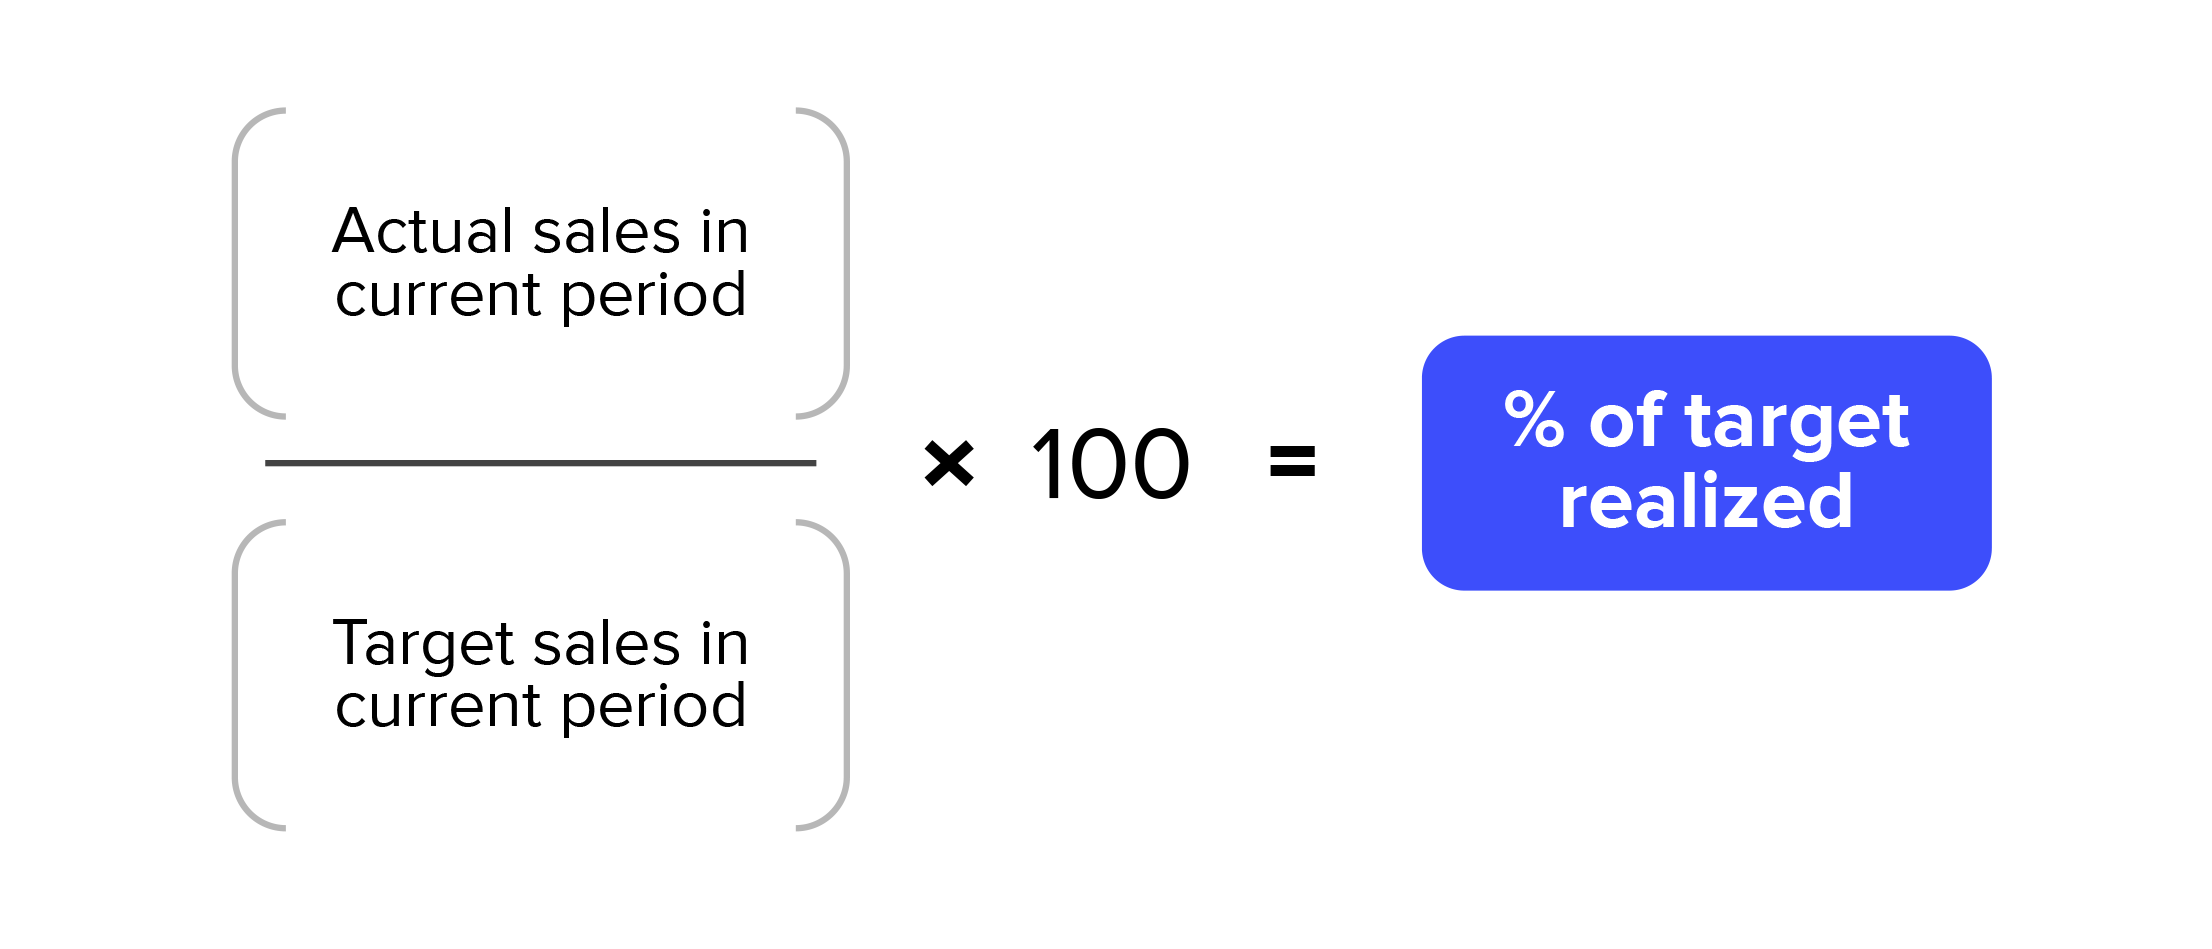
Of course, you can use this ratio for measuring your progress toward other targets, such as outreach emails sent, opportunities created, or free trials initiated.
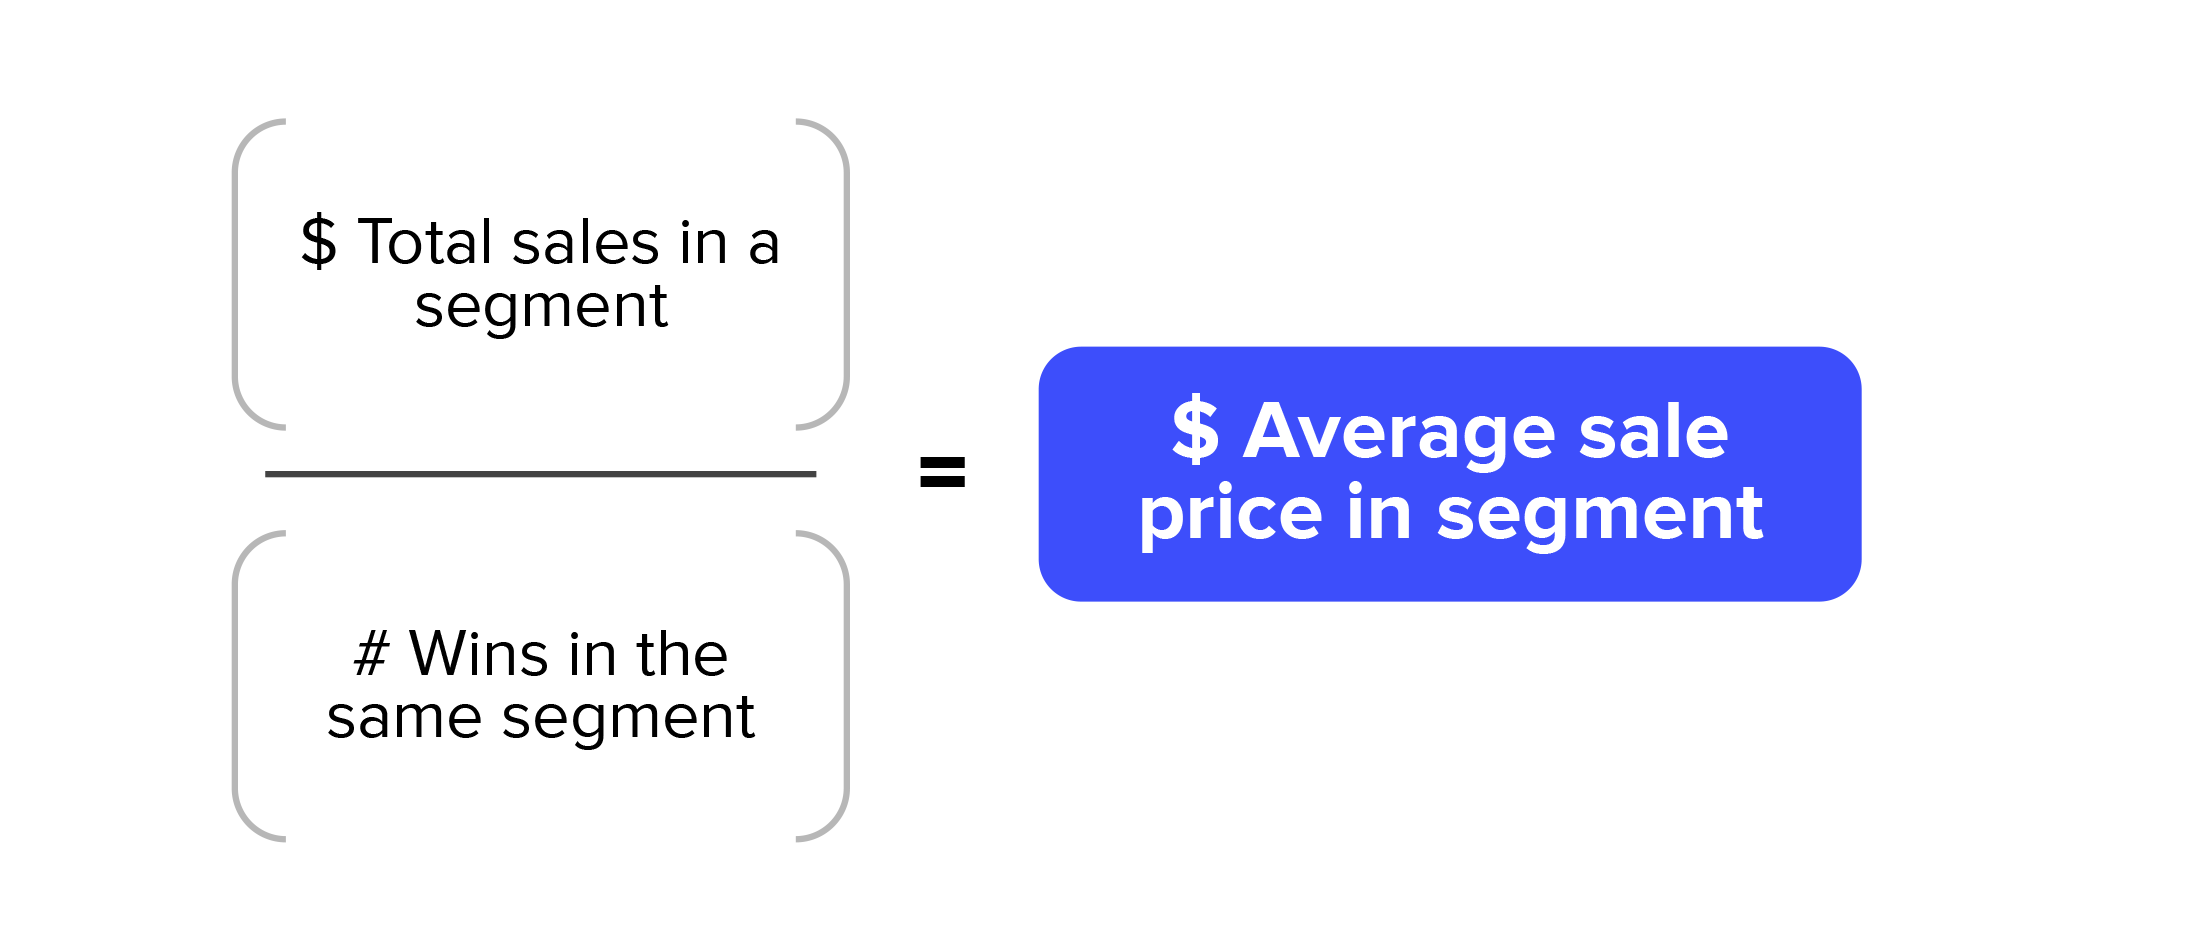
Average sale price
You want to measure both quantity and quality of sales, and a good way to measure quality is to track the average value of a win over time. You can further segment this value by industry, individual sales rep, location, and more to find where the high-value sales are coming from within your organization.
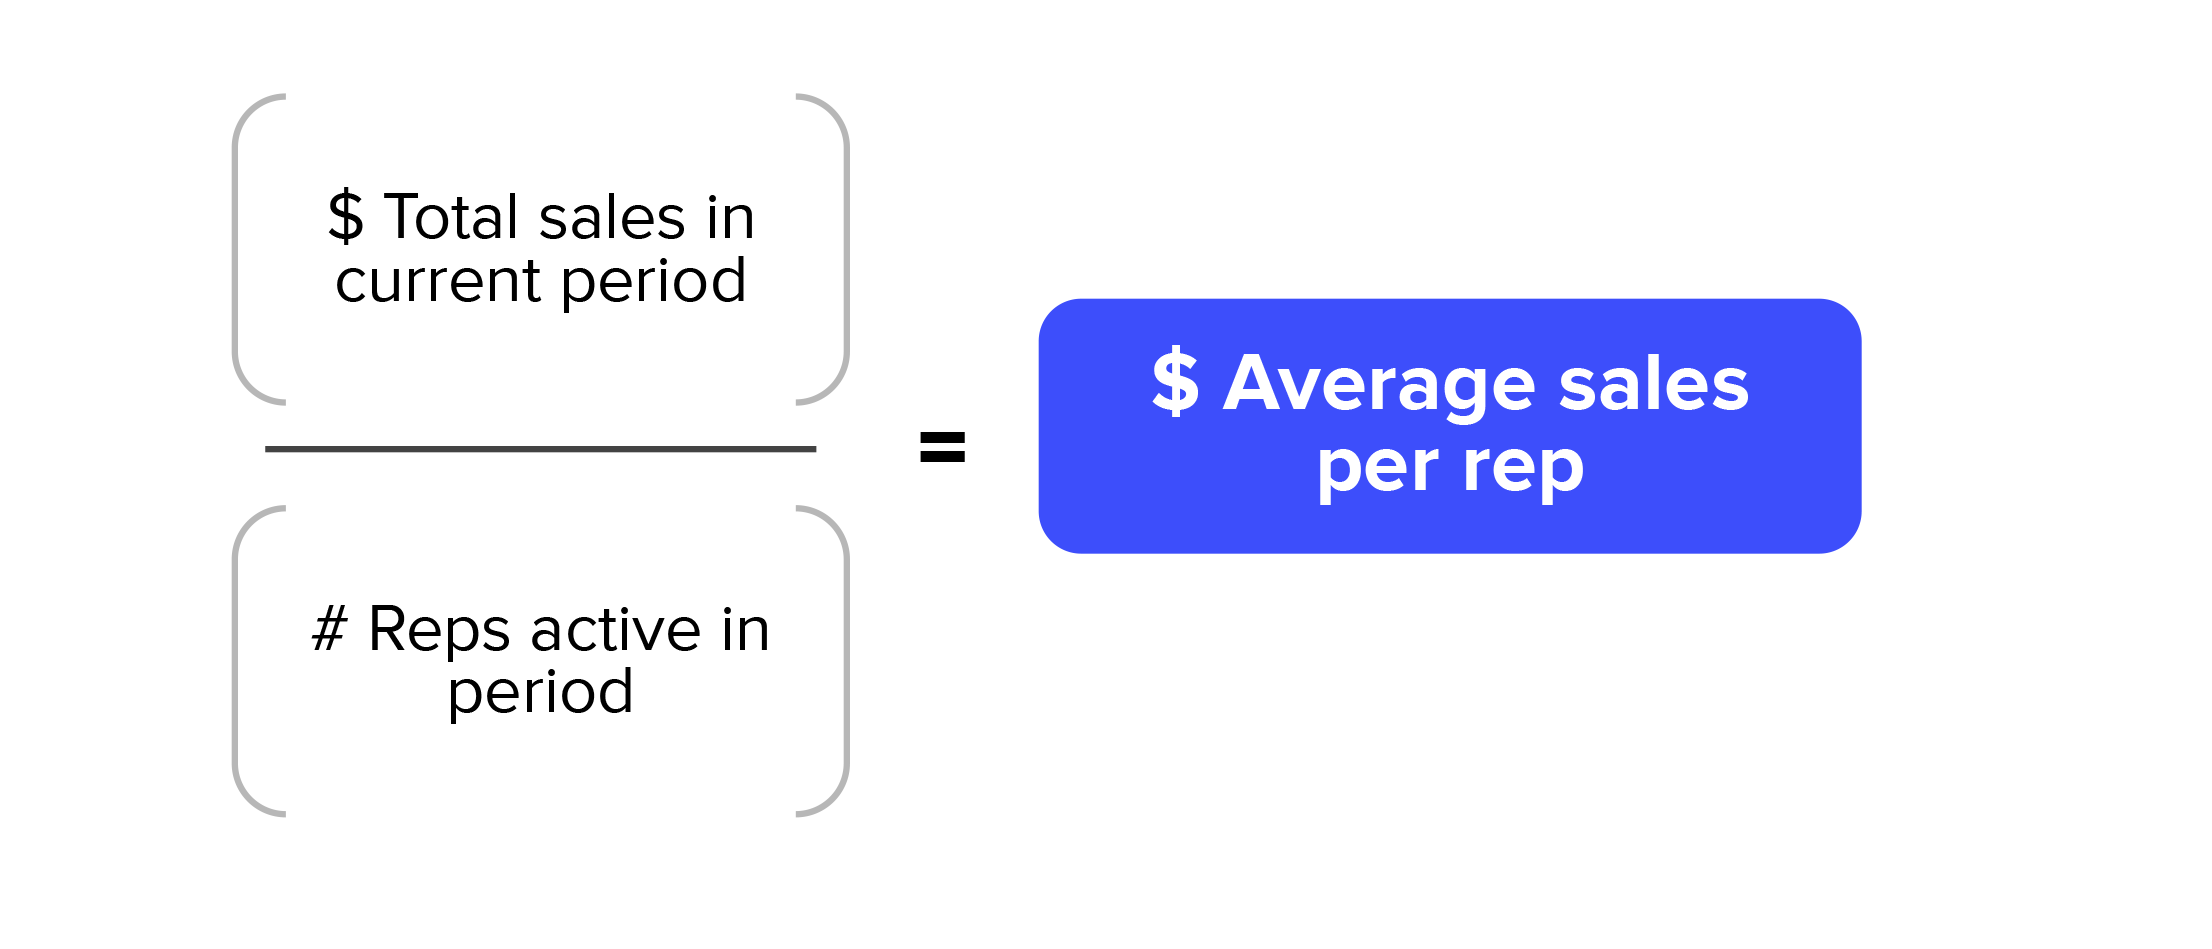
Average sales per rep
Understanding the average sales a given sales rep makes is helpful for setting baselines and expectations. (And some reps will love the challenge of beating the average.)
Of course, it’s smart to temper this number against metrics like the average attrition rate per rep, the average sales time, and the average deal size. You don’t want to motivate your sales force to inflate their quarterly sales with dud customers who only stick around for a few months!
You can use this formula to set baseline expectations for any number of inputs, too. Calculating the average number of outbound emails sent, deals closed, phone calls made, demos scheduled, quotes sent, and more can give you an idea of what a day in the life of an average sales rep at your company truly looks like. This helps with managing your team, and it also provides valuable information to candidates in the hiring process—especially when it comes to seeing what they’ll need to do in order to hit their OTE.
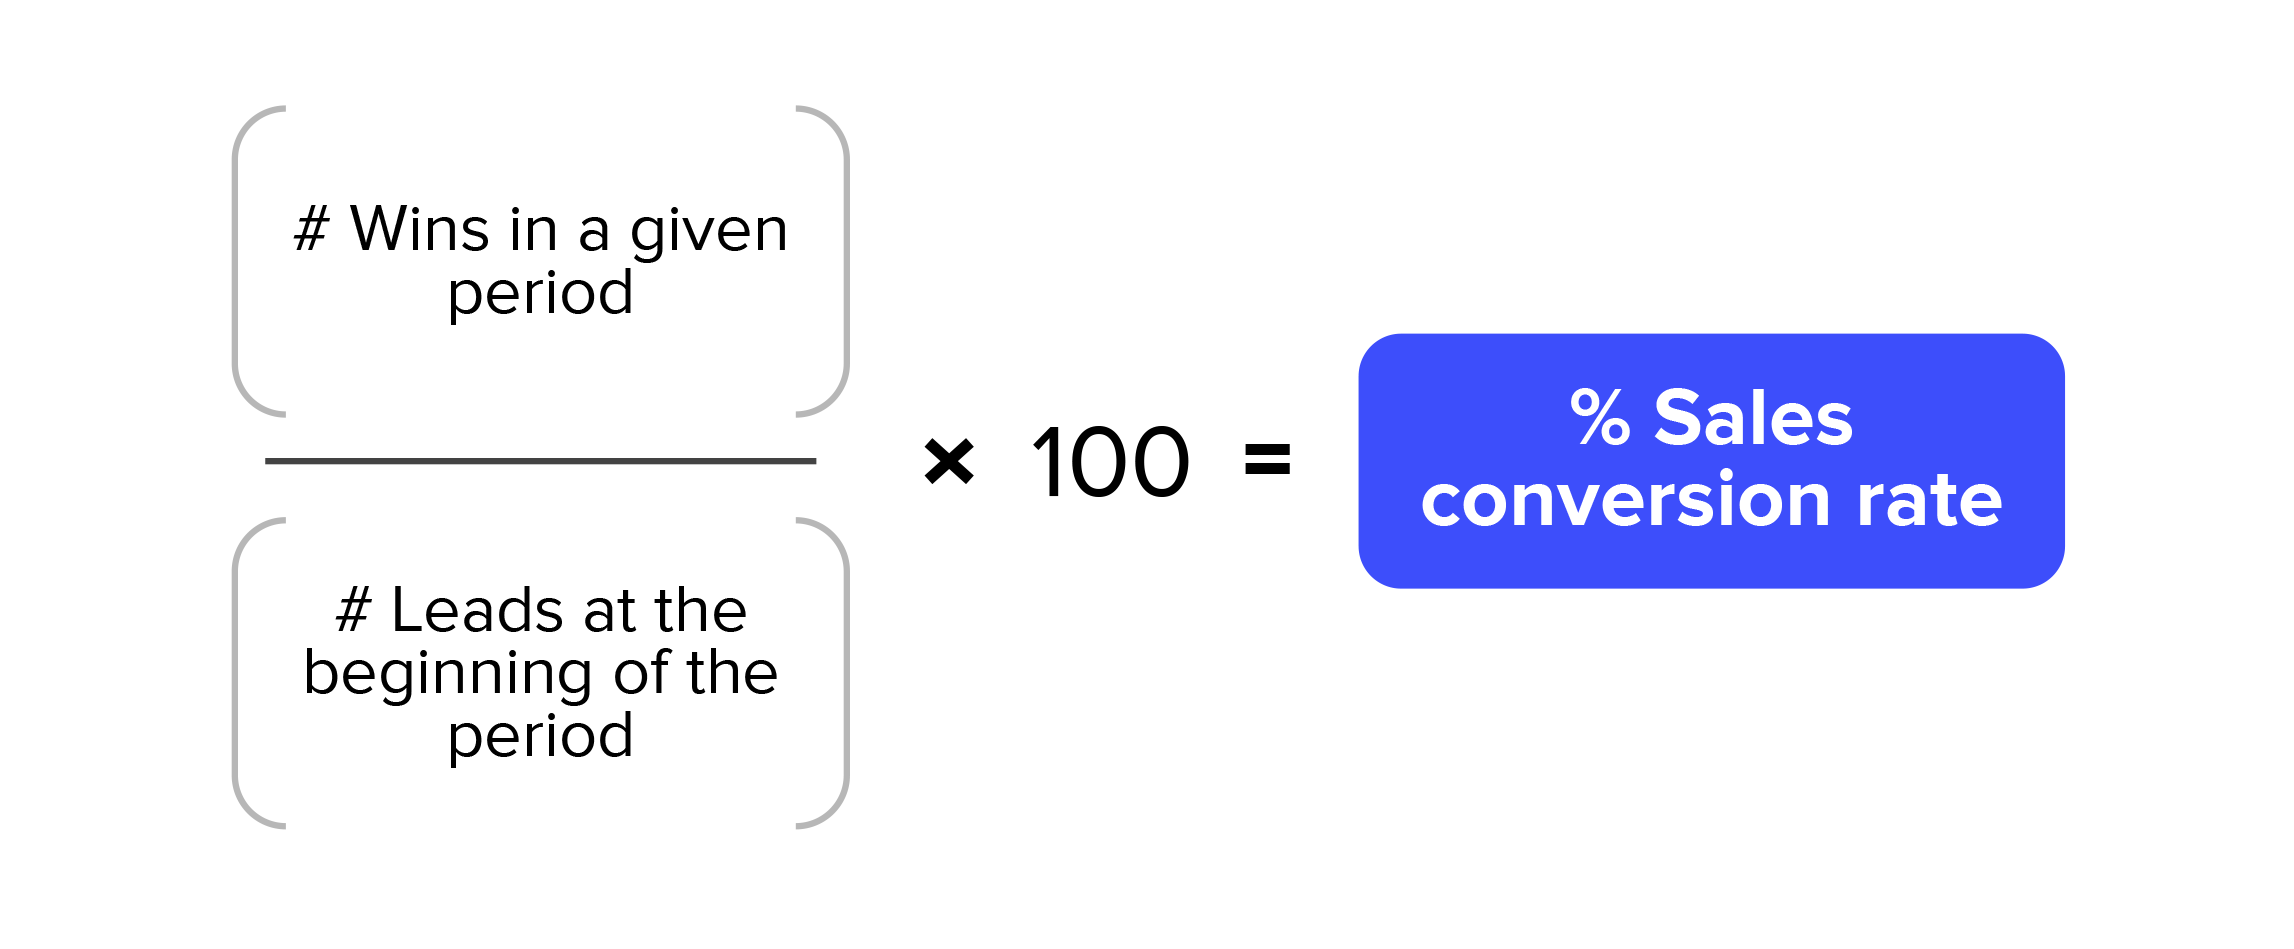
Conversion rate (and various sub-conversion rates)
Your conversion rate tells you how many wins your team gets per lead generated, and it’s a decent indicator of your teams’ effectiveness at turning leads into customers.
This is a very general way of looking at conversions, however. Some sales managers find it helpful to measure the rates at which leads progress through various stages in the pipeline.
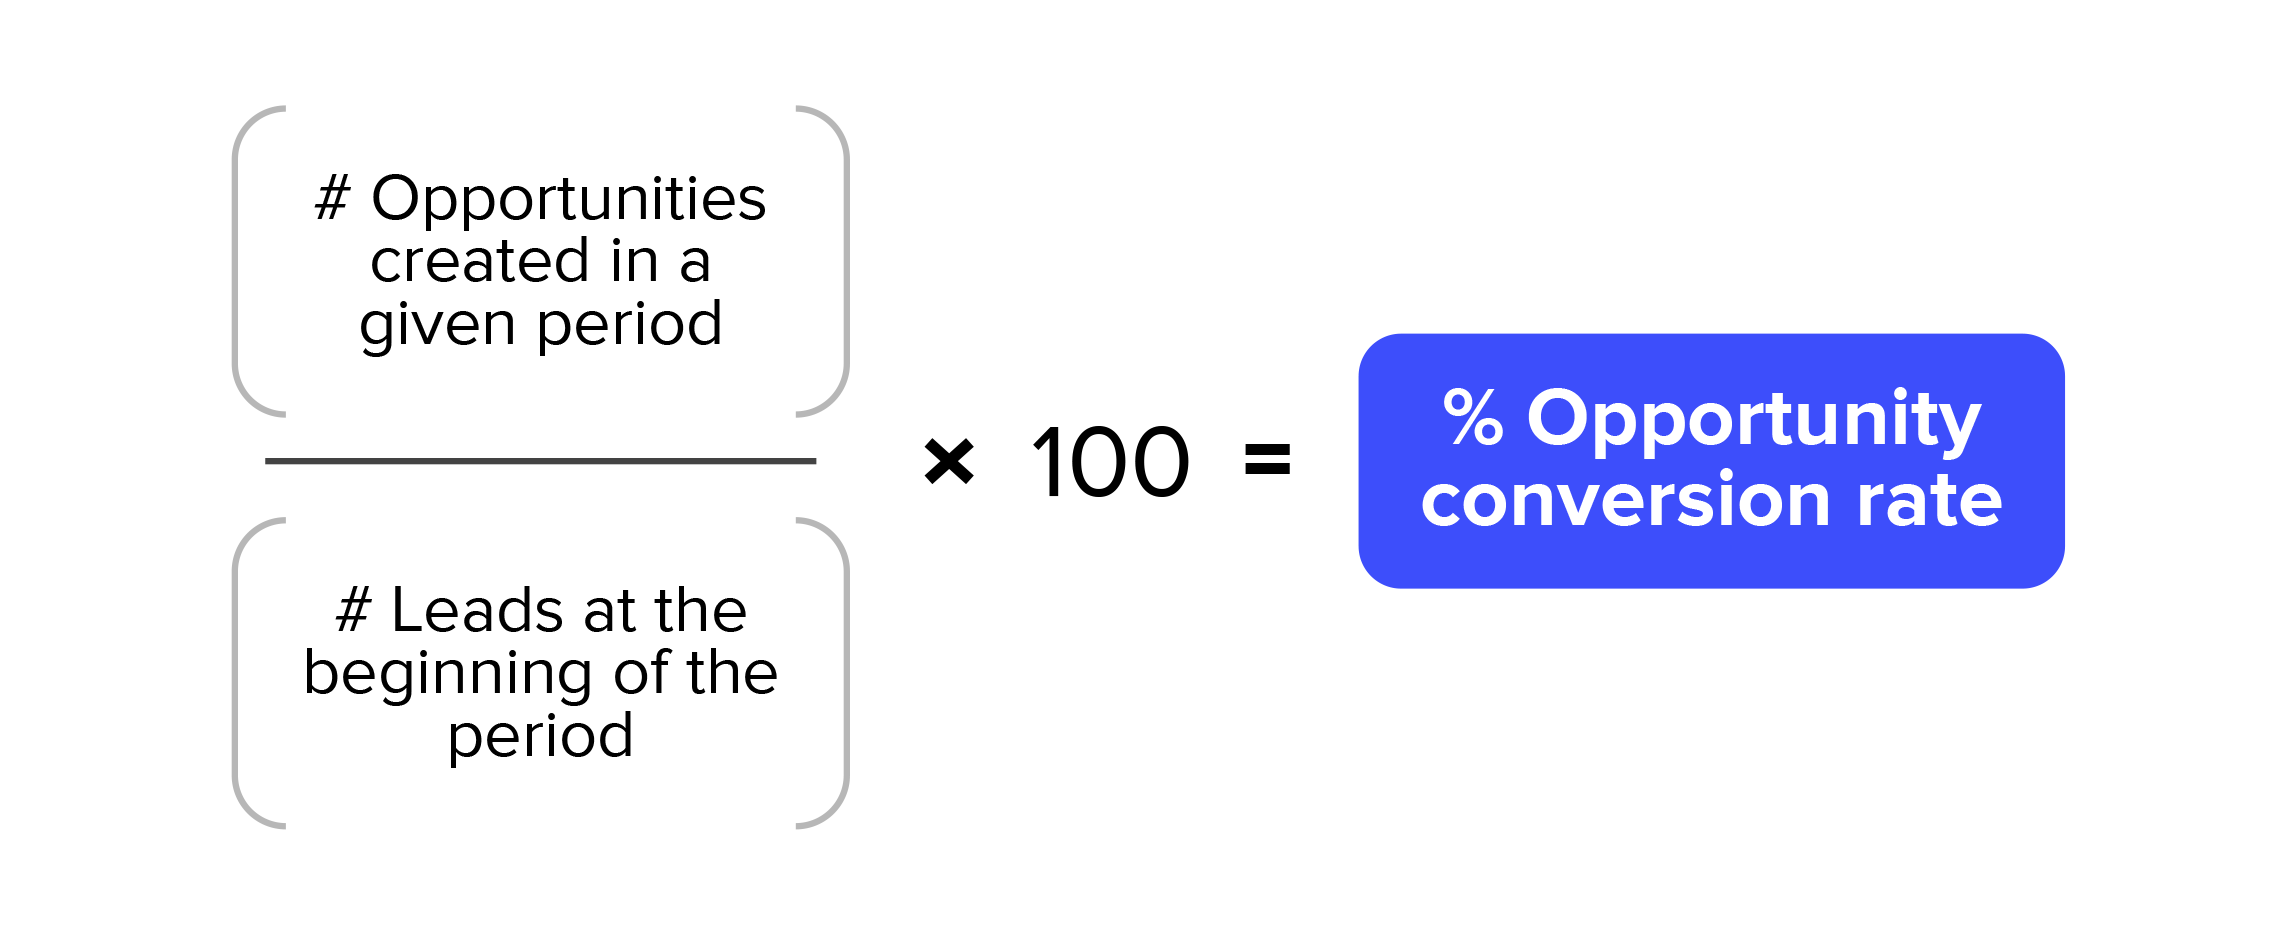
For example, you might consider measuring the opportunity conversion rate to see how many sales-qualified leads are generated from marketing qualified leads:
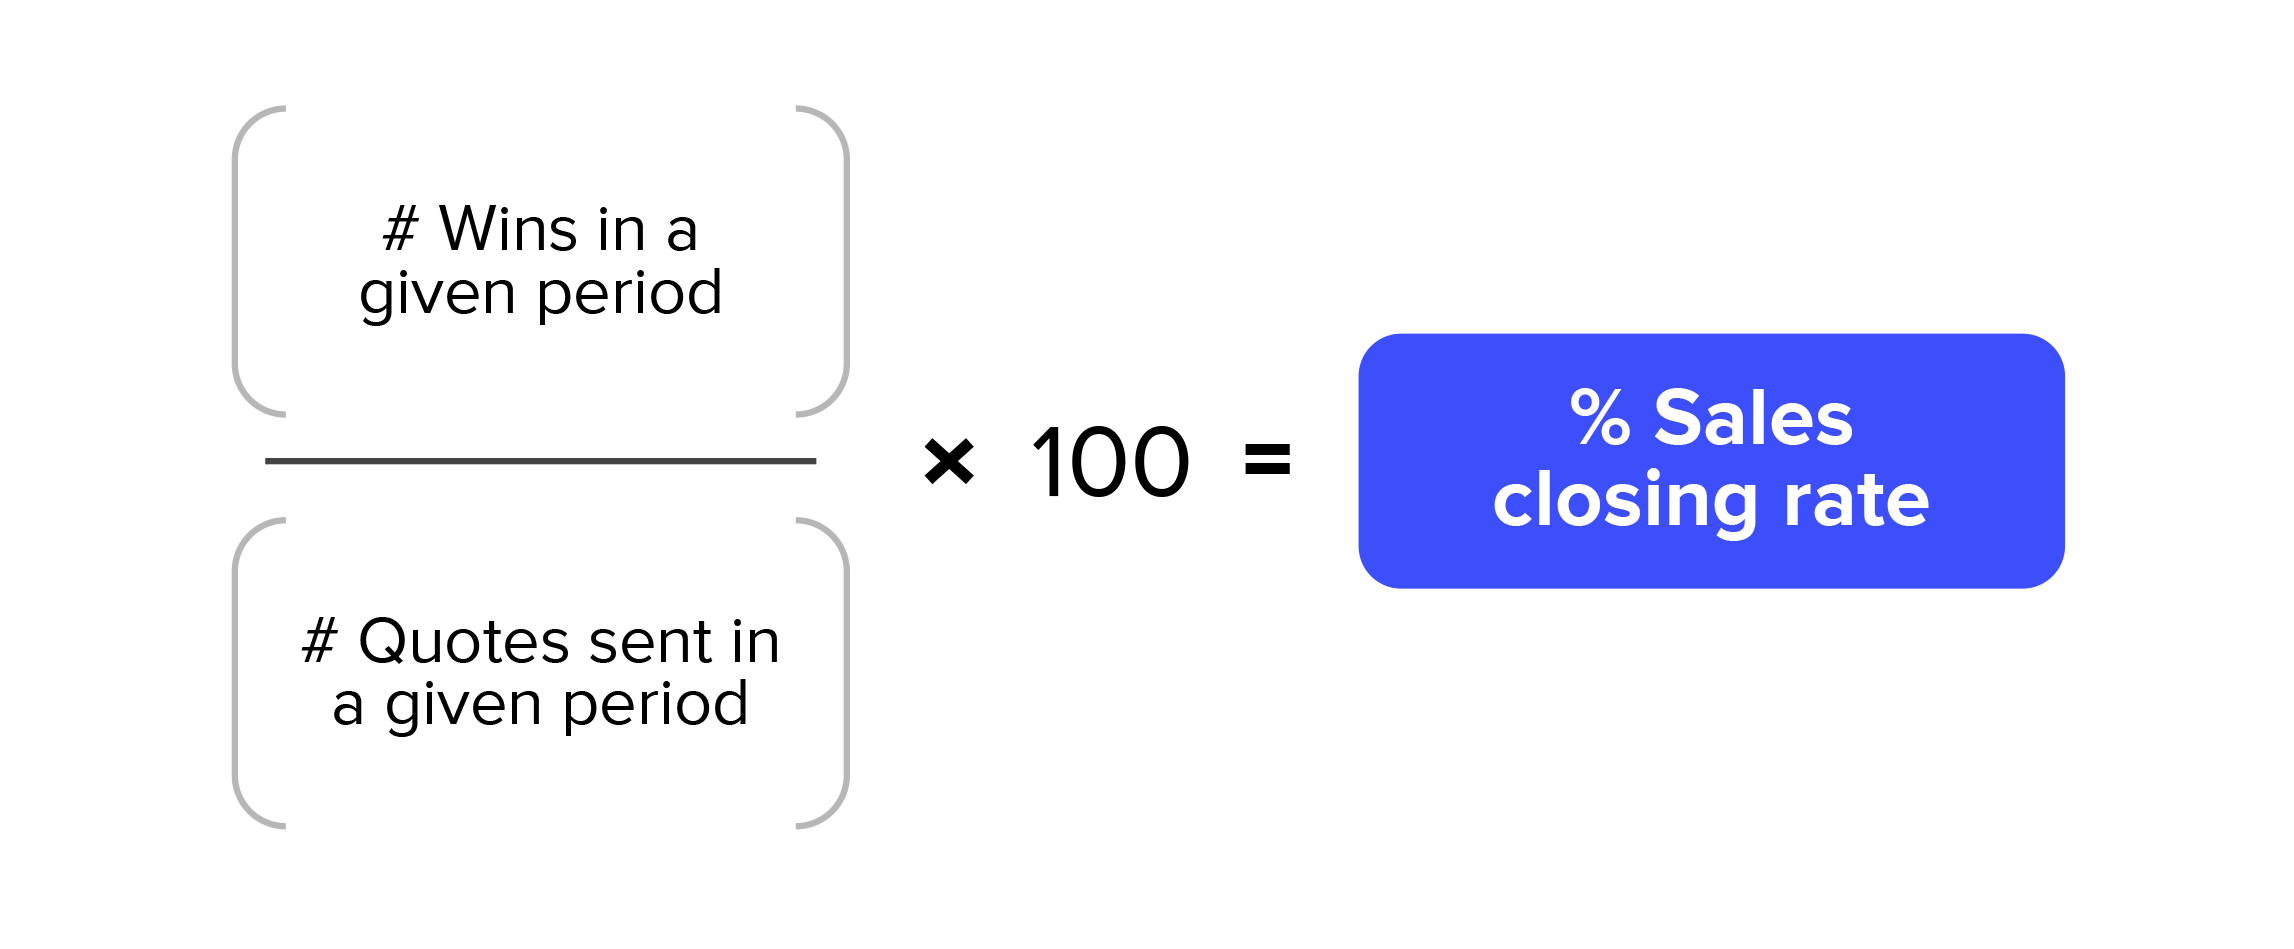
Some sales managers also like to track their sales closing rate. This KPI tells you what percentage of the quotes you’ve sent were closed. A low closing rate is a good indicator that you need to improve lead quality, pricing, quote presentation, etc.
You can apply this kind of formula to any two stages in your pipeline. Other popular metrics include:
- [Number of demos scheduled] / [Number of leads generated]
- [Number of quotes requested] / [Number of sales calls booked]
- [Number of sales calls booked / [Number of follow-up emails sent]
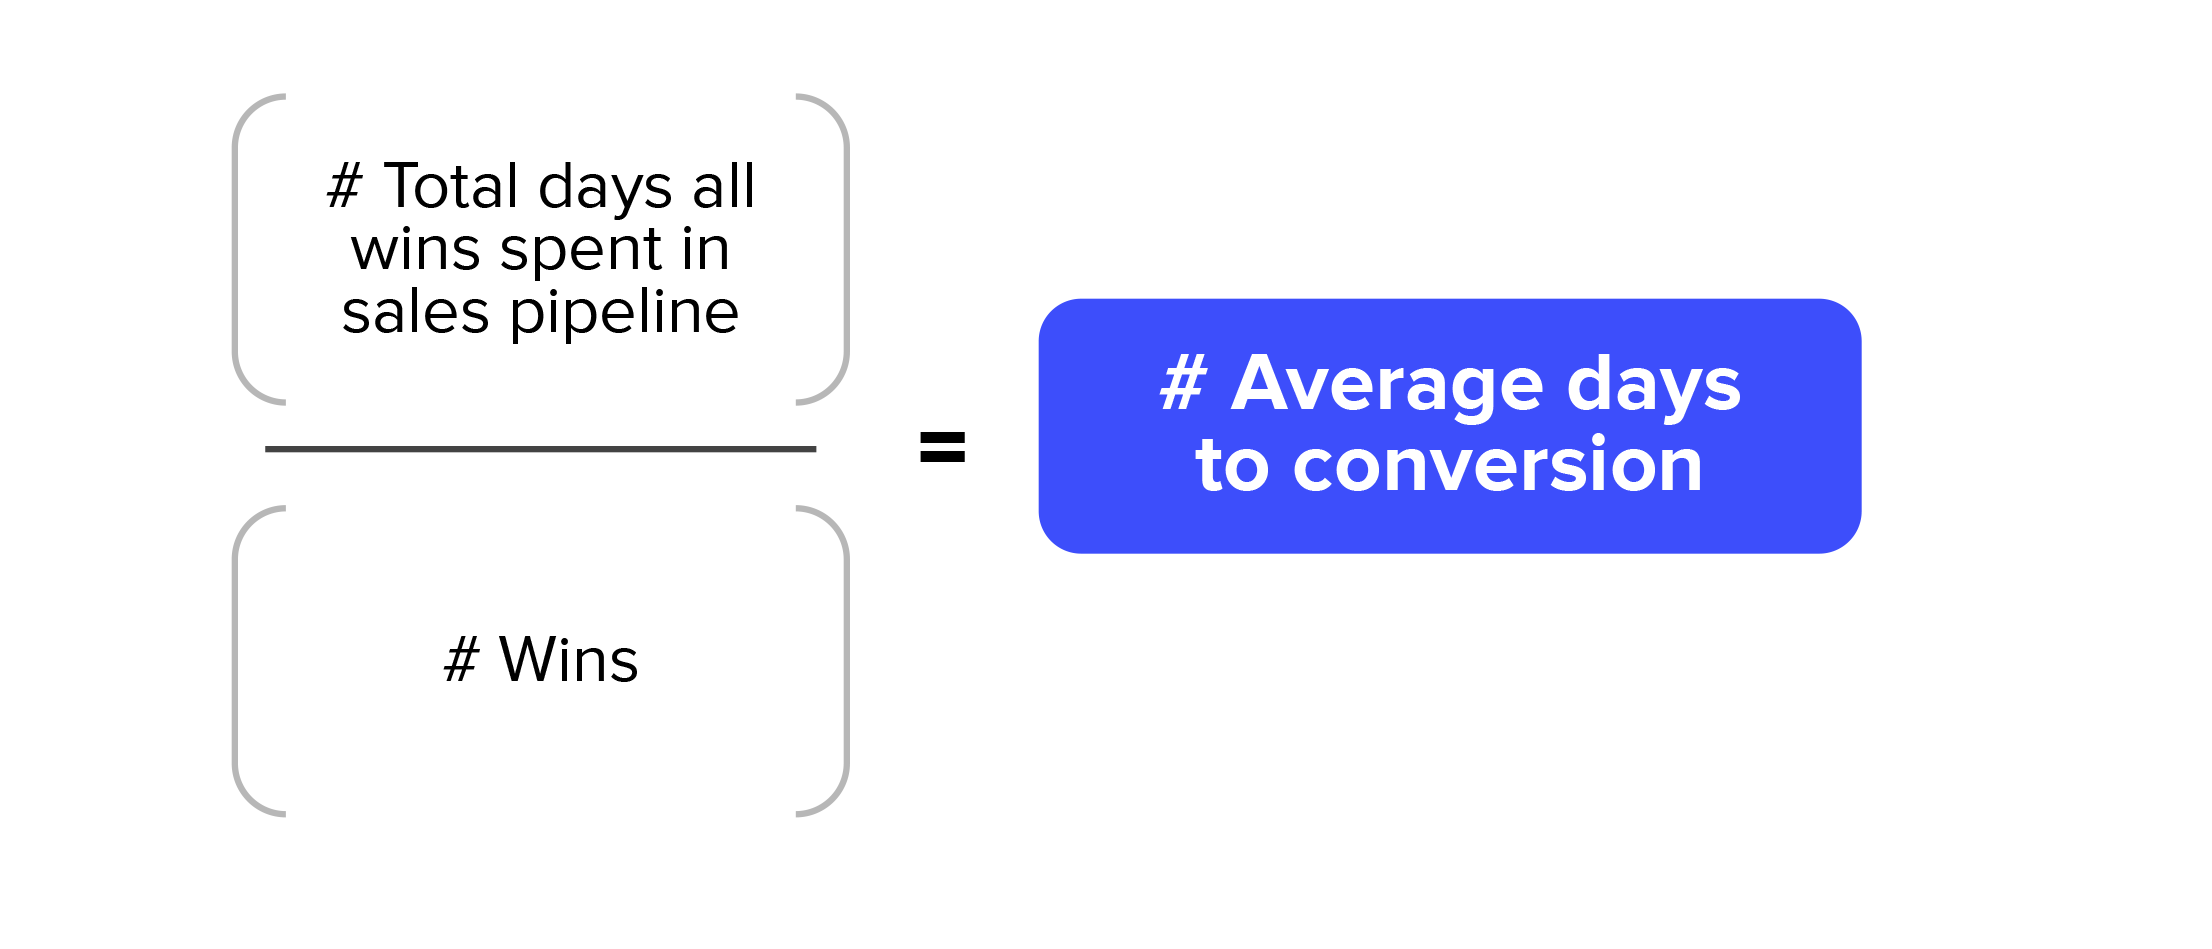
Conversion time
The longer it takes to convert a lead into a sale, the more expensive the deal becomes. Remember to include other metrics like conversion rate, sales by contact method, and sales by region to understand what is happening with your conversion time.
Sales by contact method
This KPI shows which contact methods are performing better than others. You can use this KPI to reduce efforts on low-revenue contact methods, allocate efforts to promising methods, and processes that need to be refined.
Sales by region or location
Just like it sounds, this KPI provides data on the number of sales completed in different geographical areas. Depending on the company size, this KPI may be very broad or very specific, measuring by country, state, city, or individual store location.
This tells you where your revenue is coming from, literally. You can use this metric to see if some areas are performing better than others. If a certain area is underperforming, this can give you a chance to see what internal or external factors might be affecting your business at the geospatial level.
Pipeline value
It isn’t enough to focus on the value of wins—you also want to keep an eye on the value of the deals still in your pipeline. By combining your pipeline value with your conversion rate, you can forecast future sales more accurately.
Using the potential sales numbers for each opportunity allows sales reps and sales managers to know if they’re hitting the mark on their primary targets or other sales goals.
To calculate this, simply sum up the values of every potential deal in your pipeline.
How to choose which KPIs to track in your dashboard
You can track all these sales KPIs and more—but the quantity of KPIs that you track isn’t the most important thing to focus on. What’s more important is to focus on a handful of especially helpful KPIs that you can feed into a dashboard and monitor continuously. When one KPI starts straying off course, you can drill down further to see where the problem lies.
A good analogy to keep in mind when assembling your KPIs dashboard is your car’s literal dashboard. Think of all the various metrics that you could track with a motor vehicle: speed, RPMs, fuel level, mileage, engine temperature, headlight luminosity, weight capacity, tire pressure, etc. If you put a gauge for every single possible piece of data on your car’s dashboard, it would be larger than the car itself!
Just like your car’s dashboard allows the driver to monitor a few key indicators, a sales manager’s dashboard should only pull in the important KPIs (which makes sense—that’s what makes them “key” performance indicators).
Track sales KPIs that tell the whole story
When you’re choosing KPIs, be sure to choose metrics that encompass the efforts and results of your sales team. You need to cover both: otherwise you’re only getting part of the story.
For example, if you only track the number of calls and emails made by your sales reps (and not the sales results), you’ll get an idea of how hard your team is working. But you won’t know if they’re working effectively.
Likewise, if you only track outputs such as deals closed and dollars made, you’ll overlook the processes that got you there. A sales rep might create thirty new opportunities in a month but close no deals. If you don’t take the whole pipeline into account, you won’t see the valuable work that your team has put in.
Tracking sales KPIs benefits your entire organization
It’s easy to assume that KPIs are simply useful for managers. But thoughtful, strategic use of KPIs benefits your entire organization:
Sales leaders use sales KPIs to measure individual and sales team performances, create strategies for future growth, and identify weaknesses in the sales process or sales team itself.
Executives use sales KPIs to see the growth trajectory of sales—which informs other strategic decisions. (Plus, sales KPIs can be useful to mention in earnings calls and company town halls.)
Sales reps use sales KPIs to see if they’re hitting their own sales targets and meeting their goals. They’re also useful for friendly internal competition!
Bringing all these numbers together in a meaningful way can give your sales team (and your whole organization) a new level of transparency. When KPIs are accurately tracked and objectively analyzed, they provide tremendous value: the numbers tell the story of your business’s growth, and make it obvious how each salesperson plays a role in that story.
Beautiful, customizable sales KPI dashboards from Performio
If you want to uplevel your sales performance management, reassessing your KPIs is an excellent place to start. And with Performio, you can give your salespeople the tools they need to build their own custom dashboards to track their own KPIs (like deals closed, personal quotas, and commissions earned).
To see how Performio can help your sales team and your sales compensation admins become more efficient and productive, schedule a demo today. We’d love to show you how it works!

Related Posts


